Flat Sold Prices Near SE15 5TF Peckham What the Numbers Really Tell You
HM Land Registry data for flats near SE15 5TF shows a wide spread across two decades. Here is how to read it without fooling yourself.
What the data actually covers
This piece is built entirely on HM Land Registry sold price records for flats in the SE15 5TF postcode area of Peckham. Every figure you see below comes straight from that dataset. Nothing has been estimated or adjusted.
One sale was removed before any analysis. Land Registry flags certain transactions as category B, which means bulk or non-standard transfers, things like housing association portfolio deals, that would badly skew a like-for-like comparison. Excluding it is the right call, and you should always check whether any dataset you rely on has done the same.
The headline numbers and why the median is misleading here
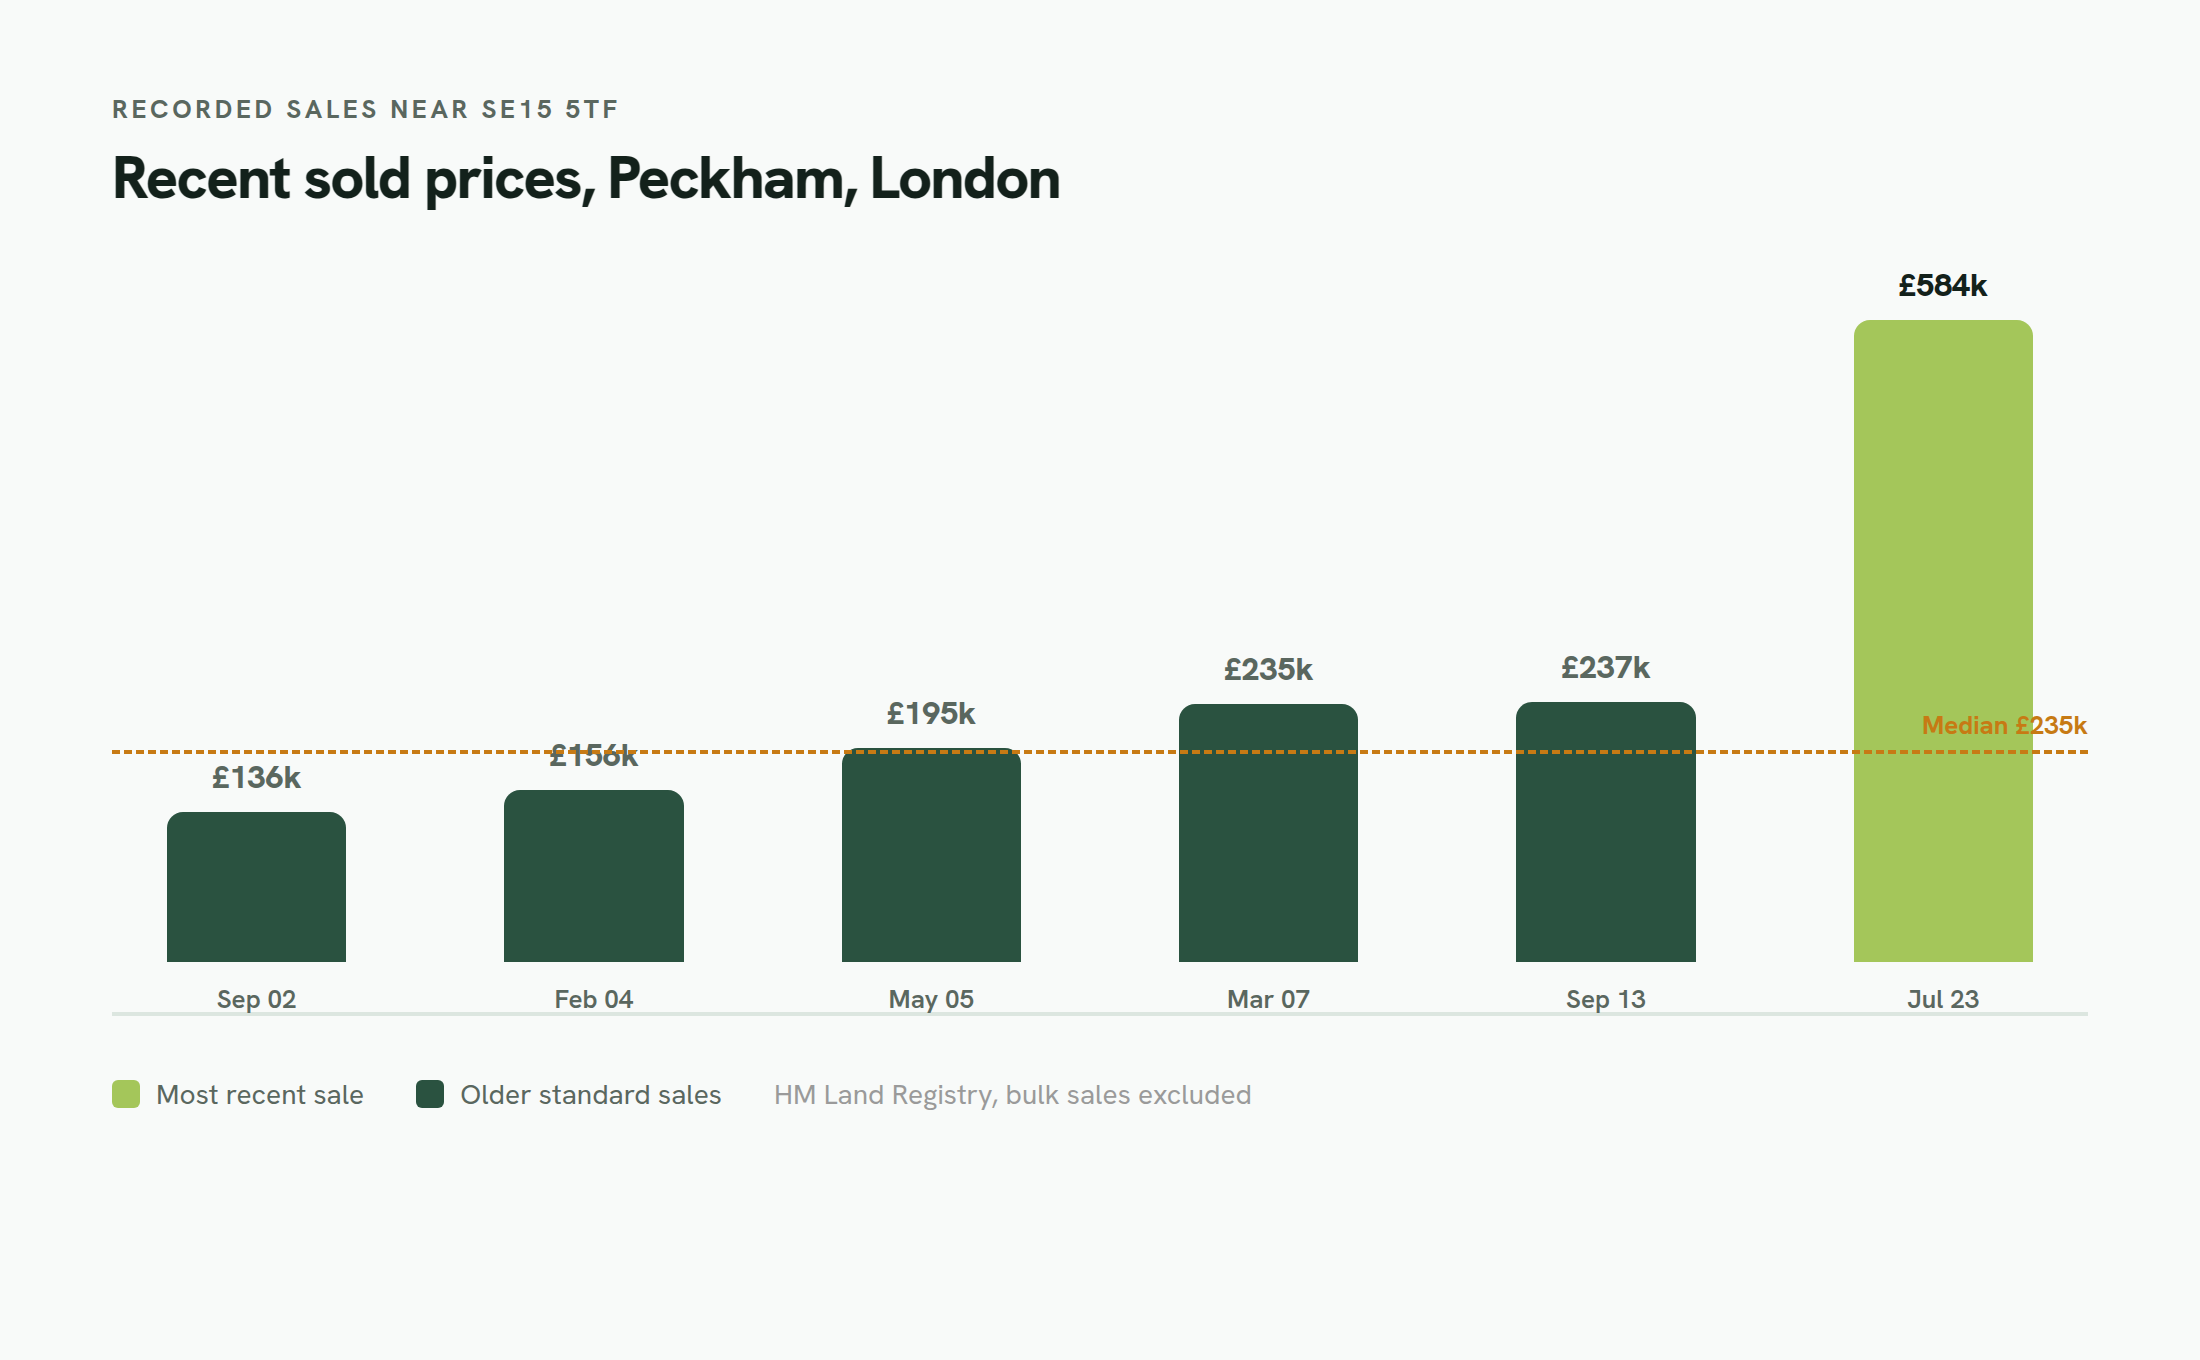
The median sold price across the remaining five transactions works out at two hundred and thirty-five thousand pounds. On the surface that sounds like a useful anchor. It isn't, and you need to understand why before you use it in any negotiation.
The sample is tiny. Five sales. In a postcode with that few data points, the median is not a market signal, it's just the middle value of a short list. Worse, most of those sales are old. The dataset stretches back to two thousand and two, and property values in Peckham have moved enormously since then. A median that blends two thousand and two prices with a two thousand and twenty-three price tells you almost nothing useful about what a flat is worth today.
The most recent sale is your real anchor
The single most important number in this dataset is five hundred and eighty-four thousand pounds, recorded on the fourteenth of July two thousand and twenty-three. That is the only sale that reflects anything close to current market conditions. Everything else is history.
When you are trying to judge what a flat near SE15 5TF is genuinely worth right now, start there. Ask yourself what has changed since mid-2023, mortgage rates, local demand, the wider London market, and adjust your thinking from that point. Do not let a median dragged down by two thousand and two prices make you think you are looking at a two hundred and thirty-five thousand pound market. You almost certainly are not.
The full picture sale by sale
Here is every transaction in the dataset so you can see the trajectory yourself.
- 1Five hundred and eighty-four thousand pounds, July two thousand and twenty-three
- 2Two hundred and thirty-seven thousand pounds, September two thousand and thirteen
- 3Two hundred and thirty-five thousand pounds, March two thousand and seven
- 4One hundred and ninety-five thousand pounds, May two thousand and five
- 5One hundred and fifty-six thousand pounds, February two thousand and four
- 6One hundred and sixty-four thousand five hundred pounds, May two thousand and two
- 7One hundred and thirty-six thousand pounds, September two thousand and two
- 8Eighty-two thousand pounds, May two thousand and two
That jump from two hundred and thirty-seven thousand pounds in two thousand and thirteen to five hundred and eighty-four thousand pounds in two thousand and twenty-three is striking. A decade of Peckham's transformation, the restaurants, the regeneration, the buyer demand, is sitting right there in those two figures.
How to use this as a buyer
Treat the two thousand and twenty-three sale as your starting point, not the median. Then do three things. First, pull comparable sold prices from neighbouring postcodes in SE15 to see whether that five hundred and eighty-four thousand pounds figure looks typical or exceptional for the type of flat it was. Second, check Rightmove and Zoopla for current asking prices nearby, remembering that asking prices and sold prices are not the same thing. Third, instruct a RICS surveyor if you are making an offer. A valuation based on comparable evidence is worth every penny of the fee.
The data here is a starting point for your research, not a substitute for it. Small postcode datasets can be skewed by a single unusual sale, and five transactions across more than twenty years is about as thin as it gets.
The honest limitations you deserve to know
Five sales is a very small sample. One outlier, one probate sale, one motivated seller, and the whole picture shifts. The two thousand and twenty-three sale at five hundred and eighty-four thousand pounds could reflect a genuinely premium flat, a bidding war, or a market peak. Without knowing the specific property, its size, condition and floor, you cannot be certain.
Land Registry data also lags. Sales are typically registered weeks or months after completion, so even the most recent entry may not reflect what is happening on the street today. Use this data to ask sharper questions, not to close the conversation.
Common questions
- What is the most recent flat sold price near SE15 5TF in Peckham?
- The most recent recorded sale in the dataset was five hundred and eighty-four thousand pounds, completed on the fourteenth of July two thousand and twenty-three. This is the strongest single indicator of current values and should carry far more weight than the older transactions in the same dataset.
- Why is the median sold price of two hundred and thirty-five thousand pounds so much lower than the latest sale?
- Because the median is calculated across five sales that span more than twenty years, with several transactions from two thousand and two through to two thousand and seven when Peckham prices were a fraction of what they are now. Mixing those old figures with a two thousand and twenty-three sale produces a median that reflects the past far more than the present.
- What does it mean that one sale was excluded from the data?
- HM Land Registry classifies certain transactions as category B, covering things like bulk transfers and non-standard sales that do not represent a straightforward open-market purchase. One such sale was removed from this dataset before analysis. That is standard good practice and makes the remaining figures more reliable for a buyer trying to judge fair market value.
- Should I rely on this data alone when making an offer on a flat in Peckham?
- No, and that is not a criticism of the data, it's just the reality of a five-sale sample covering two decades. Use the two thousand and twenty-three figure as an anchor, cross-reference with broader SE15 sold prices, look at current asking prices, and get a RICS valuation before you commit. This data sharpens your questions; it does not replace professional advice.
Sources
Have a property in mind? Check it before you offer.
Paste the Rightmove or Zoopla link and Flatscope reads the lease, the real running costs and the sold-price record, every figure cited. Three free reports a month, no card. Your first run needs no signup.
From the buyer's guides
More insights
Flatscope is informational software, not regulated financial or legal advice. Figures are read from public records at the time of writing and can change. Confirm anything decision-critical with your solicitor or surveyor.