Newcastle Quayside Flat Sold Prices What Buyers Need to Know
HM Land Registry data shows flats across the wider Newcastle quayside area selling anywhere from 120,000 to 485,000 pounds. Here is how to read those numbers honestly.

Why sold prices beat asking prices every time
Asking prices are marketing. Sold prices are reality. If you want to know what a flat across the wider Newcastle quayside area is genuinely worth right now, you need to look at what buyers actually handed over at completion, registered with HM Land Registry, not what a vendor hopefully stuck on Rightmove six weeks ago.
The good news is that Land Registry data is public, specific, and legally recorded. The less good news is that you have to know how to read it, because a single headline figure can mislead you just as badly as an optimistic estate agent if you do not understand what sits behind it.
The median is two hundred and twenty seven thousand pounds, but that is not the whole story
Across the wider Newcastle quayside area, the median sold price for flats in the Land Registry dataset sits at two hundred and twenty seven thousand pounds. That figure comes from a sample of one hundred and fifty eight sales, which is a decent base. It is not a tiny handful of transactions, so you can take it seriously as a broad anchor.
Before you do, though, understand what a median actually is. It is the middle value when you line all the sales up in order. Half sold for more, half sold for less. It tells you nothing about the spread, and in a mixed area like this the spread is enormous. It also covers a period of time, not just this week. Markets move. A multi year median can be dragging in sales from a period when conditions were quite different to today.
Twenty nine sales were stripped out before the median was calculated. Those are what Land Registry calls category B transactions, bulk or non market sales, things like transfers between companies, repossessions sold at auction in bulk lots, or sales between related parties at non market prices. Excluding them is the right call. You want to know what arms length buyers paid, not what happened in a portfolio deal.
The most recent sale is your sharpest anchor
Here is the thing most people miss. The most recent individual sale in this dataset is a far better anchor for what the market is doing right now than any median built from years of data.
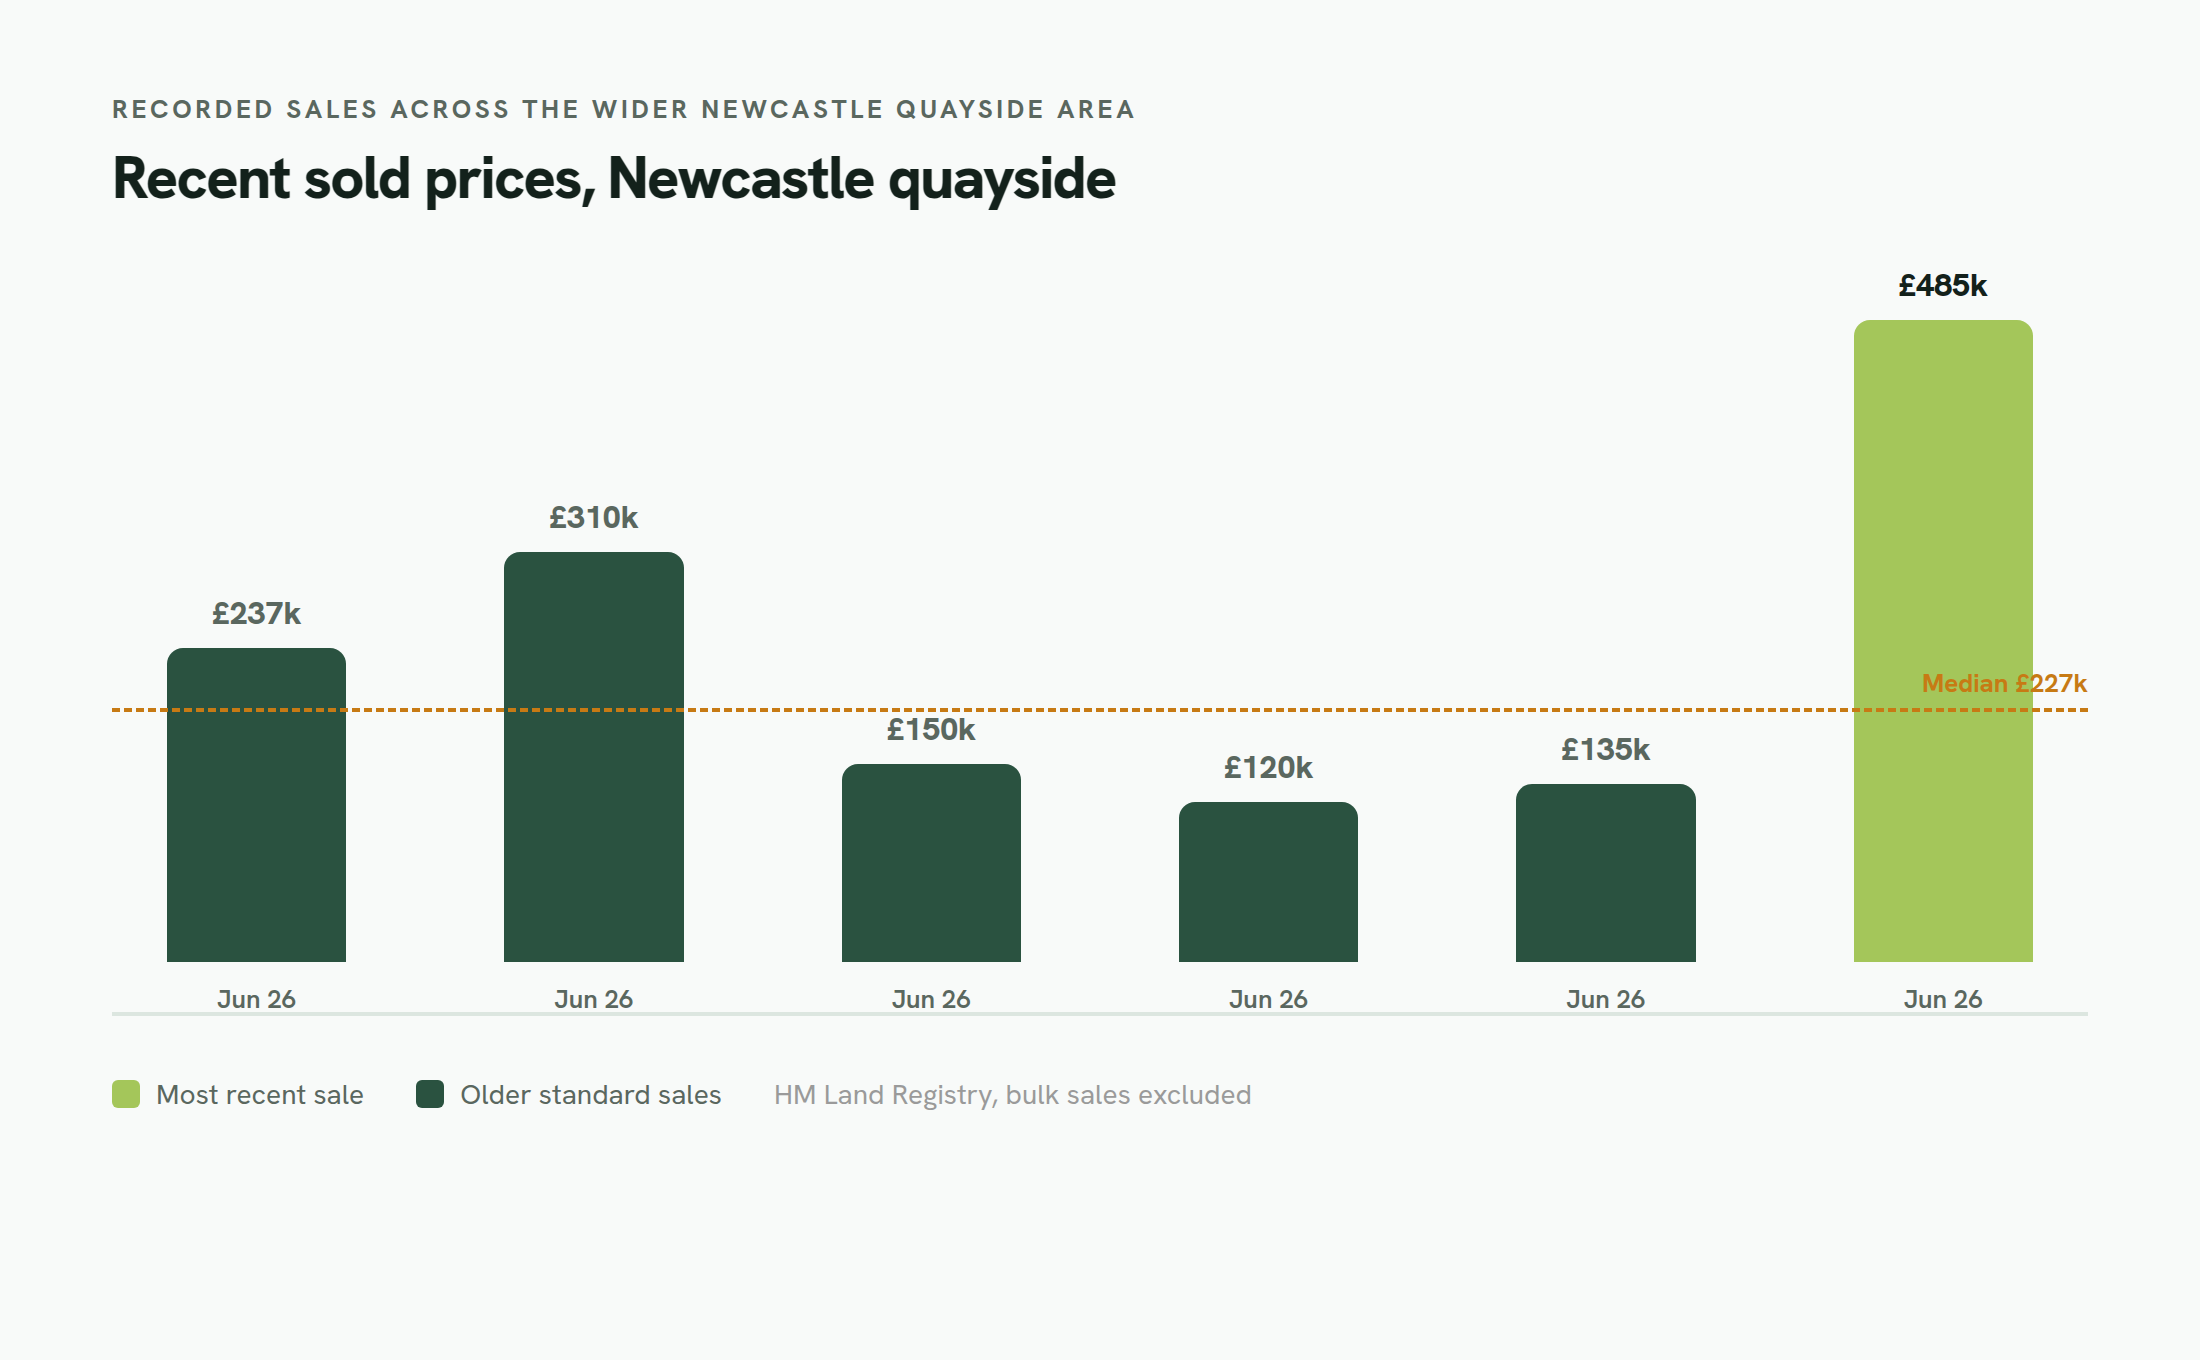
The most recent registered sale across the wider Newcastle quayside area completed on the twenty fifth of June twenty twenty six at four hundred and eighty five thousand pounds. That is a real buyer, a real seller, a real negotiation, completed in the current market with current mortgage rates and current sentiment baked in. It is one data point, so you cannot generalise wildly from it, but it tells you something the median cannot, which is that the top of the active market right now is well above two hundred and twenty seven thousand pounds.
If you are buying a premium riverside apartment with a concierge and a view, you are not competing in the same market as the median. Four hundred and eighty five thousand pounds is the live evidence of where that segment sits.
What the recent sales cluster tells you
Looking at the eight most recent sales registered gives you a much richer picture than any single figure. In the days around late June twenty twenty six, completed sales across the wider Newcastle quayside area ranged from one hundred and twenty thousand pounds right up to four hundred and eighty five thousand pounds. That is a spread of three hundred and sixty five thousand pounds between the cheapest and the most expensive in the same short window.
Breaking them down, you had sales at one hundred and twenty thousand pounds on the twenty second of June, one hundred and thirty five thousand pounds on the twenty fourth, and then four sales on the nineteenth of June alone at one hundred and fifty thousand, two hundred and thirty seven thousand five hundred, three hundred and ten thousand, and three hundred and fifty seven thousand pounds. The nineteenth also saw a sale at three hundred and ninety five thousand pounds.
What does that cluster tell you? It tells you this is not a homogeneous market. A studio or a small one bed in a converted building and a two bed waterfront apartment with parking are both called flats, but they are not competing with each other. When you are valuing a specific property, you need to find the comparable sales that genuinely match it, not just average everything together.
How to use this data when you are making an offer
Start with the median of two hundred and twenty seven thousand pounds as your broad orientation. If the flat you want is priced well above that, you need to understand why. Is it genuinely a premium unit, or is it an ambitious vendor? If it is priced well below, ask the same question in reverse.
Then look at the recent sales cluster. Find the transactions that most closely match what you are buying in terms of size, floor, finish, and whether it has parking or outdoor space. The six sales between one hundred and twenty thousand and three hundred and ninety five thousand pounds in June twenty twenty six show you the realistic range for different types of flat in this area right now.
Finally, weight the most recent sales more heavily than older ones. A sale from two years ago is historical context. A sale from last week is live market intelligence. The four hundred and eighty five thousand pound sale on the twenty fifth of June twenty twenty six is the freshest evidence you have of where a buyer and seller agreed on value in this market.
A few honest caveats before you rely on any of this
Land Registry registration lags completion by several weeks, sometimes longer. So even the most recent registered sale may reflect a deal that was agreed months ago. In a fast moving market that matters.
The dataset covers the wider Newcastle upon Tyne local authority area, not a single street or postcode. Flats right on the quayside with river views are not the same as flats half a mile inland, even if they sit within the same administrative boundary. Use this data to calibrate your expectations, then get a surveyor to give you a view on the specific property.
And remember, none of this is a substitute for a proper valuation. These are sold prices, not valuations. They tell you what buyers paid, which is the best available evidence of value, but a chartered surveyor looking at the actual flat will catch things a dataset cannot.
The bottom line for a first time buyer
The median of two hundred and twenty seven thousand pounds across one hundred and fifty eight sales gives you a solid starting point. The range of recent sales from one hundred and twenty thousand to four hundred and eighty five thousand pounds tells you the market here is genuinely wide, and where your flat sits in that range depends entirely on what it actually is.
The most recent sale at four hundred and eighty five thousand pounds on the twenty fifth of June twenty twenty six is the single freshest piece of evidence in this dataset. It is not typical, but it is current. Use the median for context, use the recent cluster for calibration, and use the most recent sale as a reality check on where the top of the active market sits right now. That combination will serve you far better than any single headline figure.
Common questions
- What is the median sold price for flats across the wider Newcastle quayside area?
- Based on HM Land Registry data covering one hundred and fifty eight sales, with twenty nine non market transactions excluded, the median sold price is two hundred and twenty seven thousand pounds. This covers the wider Newcastle upon Tyne local authority area, not a single street or postcode.
- What was the most recent flat sale registered in this area and why does it matter?
- The most recent registered sale completed on the twenty fifth of June twenty twenty six at four hundred and eighty five thousand pounds. It matters because it reflects current market conditions, including todays mortgage rates and buyer sentiment, more accurately than a median built from years of historical data.
- Why are some sales excluded from the Land Registry figures?
- Twenty nine sales were removed as category B transactions. These are non market sales such as bulk portfolio transfers, sales between related parties, or repossessions sold outside the open market. Excluding them means the figures reflect what genuine arms length buyers actually paid.
- How wide is the price range for flats in this area right now?
- Very wide. In the last week of June twenty twenty six alone, registered sales ranged from one hundred and twenty thousand pounds to four hundred and eighty five thousand pounds. That spread reflects the difference between smaller or older conversions and premium waterfront apartments, so matching your comparable sales carefully to the specific flat you are buying is essential.
Sources
Have a property in mind? Check it before you offer.
Paste the Rightmove or Zoopla link and Flatscope reads the lease, the real running costs and the sold-price record, every figure cited. Three free reports a month, no card. Your first run needs no signup.
No listing to hand? See a real sample report firstFrom the buyer's guides
More insights
Flatscope is informational software, not regulated financial or legal advice. Figures are read from public records at the time of writing and can change. Confirm anything decision-critical with your solicitor or surveyor.