Royal Docks Flat Prices What Recent Sales Really Tell You
HM Land Registry data covering the wider Newham area shows what buyers are actually paying for flats right now, and why one number matters more than the rest.

What the data actually covers
Before you read a single number, you need to know where it comes from. These figures are drawn from HM Land Registry sold price records covering the wider Royal Docks area, which means the whole Newham local authority, not one street or one postcode. That matters because the area is genuinely varied. You've got high-spec new builds sitting alongside older ex-local-authority stock, and the price gap between them is real.
The dataset used here covers one hundred and fifty flat sales. Fifty further transactions were stripped out before any analysis because they were bulk or category B sales, things like a developer selling an entire block to a housing association in one go. Those deals don't reflect what you'd pay as an individual buyer, so excluding them is the right call. Every figure you see below is open-market, arms-length, and relevant to you.
The median sits at four hundred and thirteen thousand seven hundred and fifty pounds
Across those one hundred and fifty sales, the median sold price for a flat comes out at four hundred and thirteen thousand seven hundred and fifty pounds. The median is a sensible measure here because it sits in the middle of the range rather than being dragged upwards by a handful of penthouse sales. It tells you that roughly half of the flats sold for less than that figure and half sold for more.
That's a useful anchor when you're first getting your bearings. If someone quotes you a price well above five hundred thousand pounds for a fairly standard flat in this area, you've got grounds to push back. Equally, if something's priced at three hundred and fifty thousand pounds, don't assume it's a bargain without understanding why it's sitting below the median.
Why the most recent sale is your sharpest reference point
Here's the thing about medians. They're built from sales that could stretch back months or even years depending on how the dataset is constructed. The market moves. Interest rates shift. A median calculated over a long window can quietly become stale without anyone flagging it.
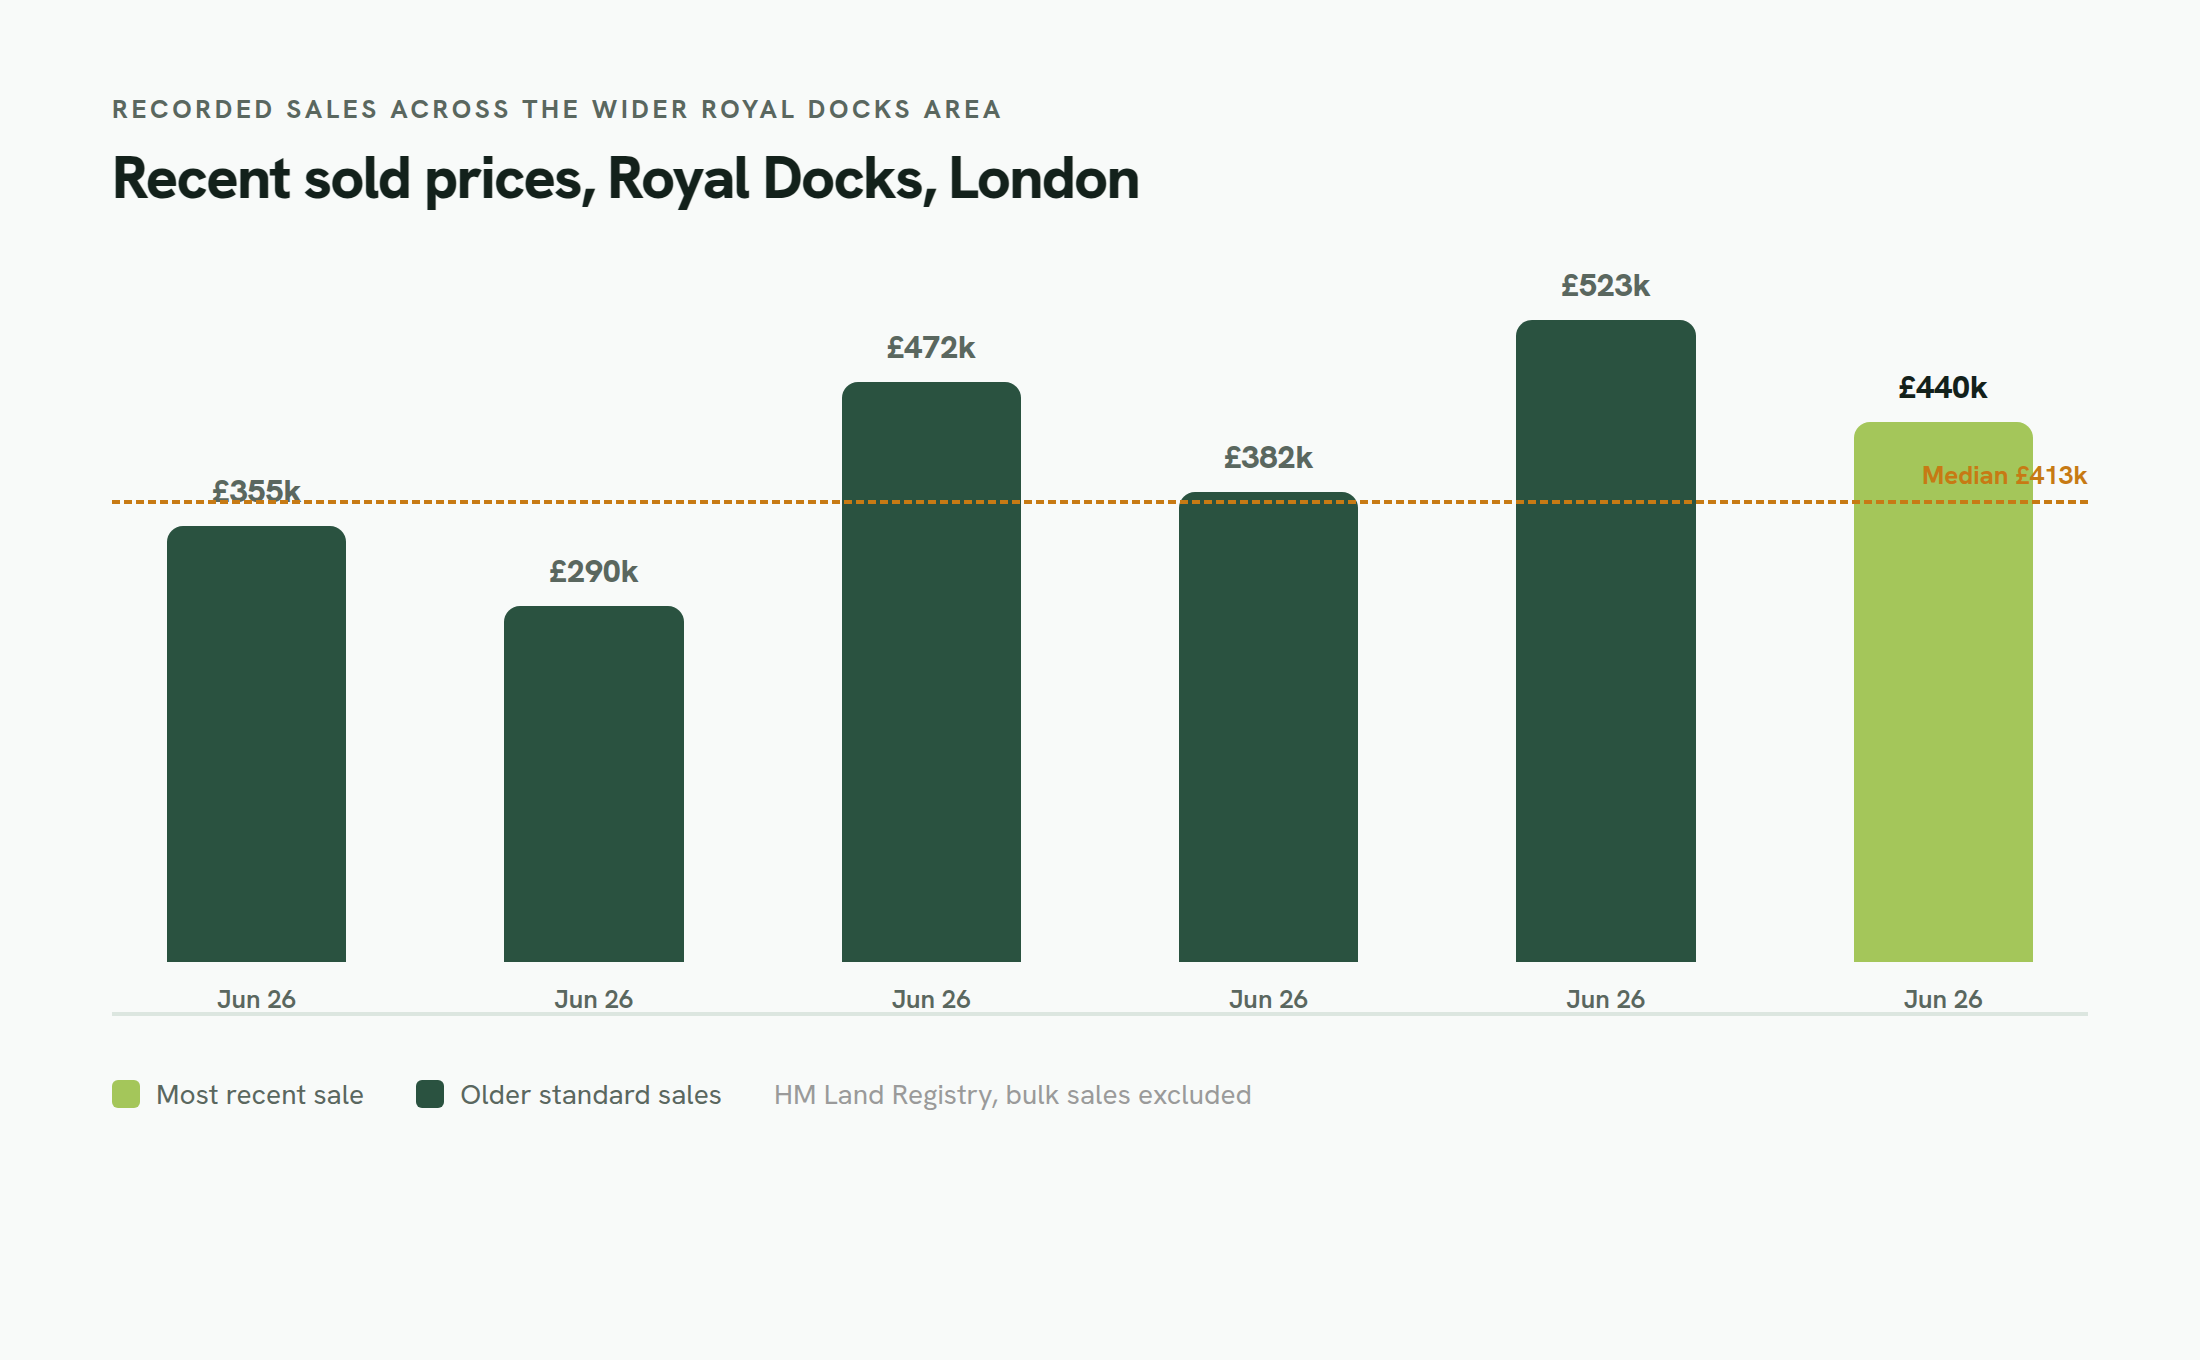
The most recent recorded sale in this dataset completed on the twenty-ninth of June two thousand and twenty-six at four hundred and forty thousand pounds. That's your freshest data point. It's one transaction, yes, and you shouldn't read too much into a single sale, but it does tell you that buyers were willing to pay four hundred and forty thousand pounds for a flat in this area just days before this piece was written. That's more current than any multi-year median, and when you're negotiating, current is everything.
The gap between that most recent sale and the median is only around twenty-six thousand pounds. That's actually reassuring. It suggests the median hasn't drifted too far from where the market is trading right now.
The spread of recent sales shows the real range
Looking at the eight most recent sales recorded, all from June two thousand and twenty-six, gives you a much richer picture than any single figure can.
- 1Four hundred and forty thousand pounds on the twenty-ninth of June
- 2Five hundred and twenty-three thousand pounds on the twenty-second of June
- 3Three hundred and eighty-two thousand five hundred pounds on the nineteenth of June
- 4Four hundred and seventy-two thousand pounds on the nineteenth of June
- 5Two hundred and ninety thousand pounds on the nineteenth of June
- 6Three hundred and fifty-five thousand pounds on the nineteenth of June
- 7Four hundred and fifteen thousand pounds on the seventeenth of June
- 8Three hundred thousand pounds on the seventeenth of June
That range, from two hundred and ninety thousand pounds up to five hundred and twenty-three thousand pounds, tells you something important. The Royal Docks area is not a single homogeneous market. A two-bedroom flat in a well-managed waterfront development and a one-bedroom flat in an older block a few streets back are both called flats, but they're not competing for the same buyer. When you're comparing asking prices, make sure you're comparing like with like.
How to use these numbers when you're viewing and offering
Go into any viewing knowing that the median for the area is four hundred and thirteen thousand seven hundred and fifty pounds and that the most recent sale was four hundred and forty thousand pounds. Those two figures give you a quick sanity check on whether an asking price is in the right ballpark.
If a flat is priced at four hundred and eighty thousand pounds, that's above both benchmarks. It might be worth it if the finish, the floor, and the service charge stack up. But you're entitled to ask the agent what comparable sales support that price. Ask them to show you actuals, not estimates.
If a flat is priced at three hundred and ten thousand pounds, look hard at the service charge, the lease length, and the building's cladding status. Low prices in this area often have a reason. The two hundred and ninety thousand pound sale in this dataset is a real transaction, so that end of the market does exist, but it's worth understanding exactly what you're buying.
A word on what these figures can't tell you
Land Registry data is brilliant because it's real. These are actual prices paid, not asking prices, not estimates, not a valuer's opinion. But it has limits.
It doesn't tell you the floor, the size, the lease length, or the condition of each flat. It doesn't tell you whether a building has passed its EWS1 fire safety assessment, which in a post-Grenfell world is genuinely material to both your mortgage offer and your ability to sell in future. It doesn't tell you what the service charge is, and in some Royal Docks developments that figure can be eye-watering.
Use these numbers as a frame, not a verdict. They tell you what the market has been paying. Your solicitor, your surveyor, and a decent independent mortgage broker will help you work out what a specific flat is worth to you.
The bottom line for a first time buyer
The median sold price across the wider Royal Docks area is four hundred and thirteen thousand seven hundred and fifty pounds, based on one hundred and fifty open-market flat sales with bulk deals excluded. The most recent sale on record, at four hundred and forty thousand pounds in late June two thousand and twenty-six, sits close to that median and gives you a live read on where the market is.
Recent sales in the area have ranged from two hundred and ninety thousand pounds to five hundred and twenty-three thousand pounds in a single week, so the spread is wide. Know your product, know your building, and use the most recent comparable sale as your anchor when you're deciding what to offer. A multi-year median is useful context. A sale from last week is a negotiating tool.
Common questions
- What is the median flat price in the Royal Docks area?
- Based on HM Land Registry data covering one hundred and fifty open-market flat sales across the wider Newham local authority, the median sold price is four hundred and thirteen thousand seven hundred and fifty pounds. Fifty bulk or category B sales were excluded from this figure to keep it relevant to individual buyers.
- What was the most recent flat sale recorded in the Royal Docks area?
- The most recent sale in the dataset completed on the twenty-ninth of June two thousand and twenty-six at four hundred and forty thousand pounds. Because it's so recent, it's arguably a more useful market indicator than a median built from older transactions.
- Why are some sales excluded from the Land Registry figures?
- HM Land Registry flags certain transactions as category B or non-standard, which typically includes bulk purchases where a developer sells multiple units to an investor or housing association in a single deal. These don't reflect what an individual buyer would pay on the open market, so they're stripped out before calculating the median. In this dataset fifty sales were excluded on that basis.
- Does the data cover just one postcode or the whole Royal Docks area?
- It covers the whole Newham local authority, which is the wider Royal Docks area. It is not specific to a single postcode or street. That means the figures reflect a broad mix of property types and locations within the area, so always compare a specific flat against the most similar recent sales you can find rather than relying solely on the overall median.
Sources
Have a property in mind? Check it before you offer.
Paste the Rightmove or Zoopla link and Flatscope reads the lease, the real running costs and the sold-price record, every figure cited. Three free reports a month, no card. Your first run needs no signup.
From the buyer's guides
More insights
Flatscope is informational software, not regulated financial or legal advice. Figures are read from public records at the time of writing and can change. Confirm anything decision-critical with your solicitor or surveyor.